Introduction
There is a dirty secret in the world of Data Science: We don’t spend our days building cool neural networks or watching “The Matrix” code rain down on our screens.
We spend 80% of our time cleaning messy Excel spreadsheets.
The golden rule of Machine Learning is simple: “Garbage In, Garbage Out.” You can have the most advanced AI model in the world (like GPT-4), but if you feed it broken, missing, or biased data, it will give you broken, missing, or biased answers.
For beginners, this is often the most frustrating hurdle. You write the code, run the model, and… Error. Or worse, it runs but gives you 50% accuracy.
This guide is your janitorial handbook. We will walk through the practical steps to turn messy, real-world data into a pristine dataset ready for AI.
Caption: The unseen pipeline: Raw data must pass through multiple “filters” before it is safe for a model to consume.
1. The “Missing Data” Crisis
In the real world, forms get submitted half-empty. Sensors break. Users refuse to tell you their age.
When your dataset has NaN (Not a Number) or empty cells, your model will crash. You have three choices:
Option A: The Nuclear Option (Drop)
-
Action: Delete any row with missing data.
-
When to use: When you have millions of rows and only 1% are broken. You can afford to lose them.
-
Risk: If you delete too much, you lose the signal.
Option B: The “Average” Fix (Impute)
-
Action: Fill the empty cell with the average (mean) or median of that column.
-
Example: If a user’s “Age” is missing, fill it with
35(the average age of your users). -
Code:
df['age'].fillna(df['age'].mean(), inplace=True)
Option C: The “Smart” Fix (AI Imputation)
-
Action: Use a smaller Machine Learning model to predict the missing value based on the other columns.
-
When to use: When accuracy is critical.
2. Handling Outliers (The “Billionaire” Problem)
Imagine you are calculating the average income of 10 people in a bar. It’s $50,000. Then Elon Musk walks in. Suddenly, the “average” income in the bar is $20 Billion.
This is an Outlier. It destroys your model because it skews the math.
How to Spot Them:
-
Visualization: Use a “Box Plot.” If you see a dot floating miles away from the rest of the data, that’s your outlier.
-
The Z-Score: Mathematically calculate how “weird” a data point is. If it is 3 standard deviations away from the mean, kill it.
The Fix: Cap the data.
-
Rule: “Any income above $200,000 will be treated as exactly $200,000.” This keeps the data realistic without losing the row entirely.
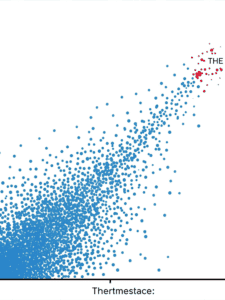
Caption: A Box Plot visually isolates outliers (the dots on the far right) that can skew your machine learning predictions.
3. The “Text” Problem (Encoding)
Computers do not understand text. They only understand numbers. If you have a column called “Color” with values [Red, Blue, Green], you cannot feed that into a neural network. You must translate it.
Bad Approach: Label Encoding
-
Red = 1, Blue = 2, Green = 3.
-
The Problem: The model thinks “Green” (3) is greater than “Red” (1). It implies a ranking that doesn’t exist. Colors aren’t numbers.
Good Approach: One-Hot Encoding
-
Create 3 new columns:
Is_Red,Is_Blue,Is_Green. -
If the car is Red, the row looks like:
[1, 0, 0]. -
This removes the mathematical bias.
4. Scaling: Making Everyone Equal
Imagine you have two columns:
-
Age: 0 to 100.
-
Salary: 0 to 100,000.
In the math of Machine Learning (specifically Gradient Descent), “Salary” will dominate “Age” simply because the numbers are bigger. The model will think Salary is 1,000x more important.
The Fix: Scaling.
-
Min-Max Scaling: Squeezes every number to be between 0 and 1.
-
Now, an Age of 50 becomes
0.5, and a Salary of $50k becomes0.5. They are now on a level playing field.
5. Feature Engineering (The Secret Sauce)
This isn’t just cleaning; it’s improving.
Sometimes, the raw data isn’t enough. You need to combine columns to create new insights.
-
Raw Data: “Date of Birth.”
-
Useless for Model: A machine doesn’t care about the year 1990.
-
Feature Engineering: Calculate “Age” (Current Year – Birth Year). Now the model understands.
-
Raw Data: “Timestamp of Transaction” (e.g.,
2025-12-07 14:30). -
Feature Engineering: Extract “Hour of Day.” Maybe fraud happens mostly at 3 AM. The raw timestamp hides that pattern; the “Hour” feature reveals it.
Conclusion: Love Your Data
Data cleaning is tedious, unglamorous, and absolutely vital. It separates the amateurs who copy-paste code from the professionals who build robust systems.
Before you import TensorFlow or PyTorch, open your data. Look at it. Graph it. Clean it. Your model is only as smart as the data you teach it with.